· Research Team · 5 min read
xPlex: Don't Invest in These Stocks!
Warning: 89% of analyzed NASDAQ stocks fail efficiency standards! xPlex reveals shocking investment inefficiencies in major tech giants.
xPlex: Don’t Invest in These Stocks!
1. Introduction
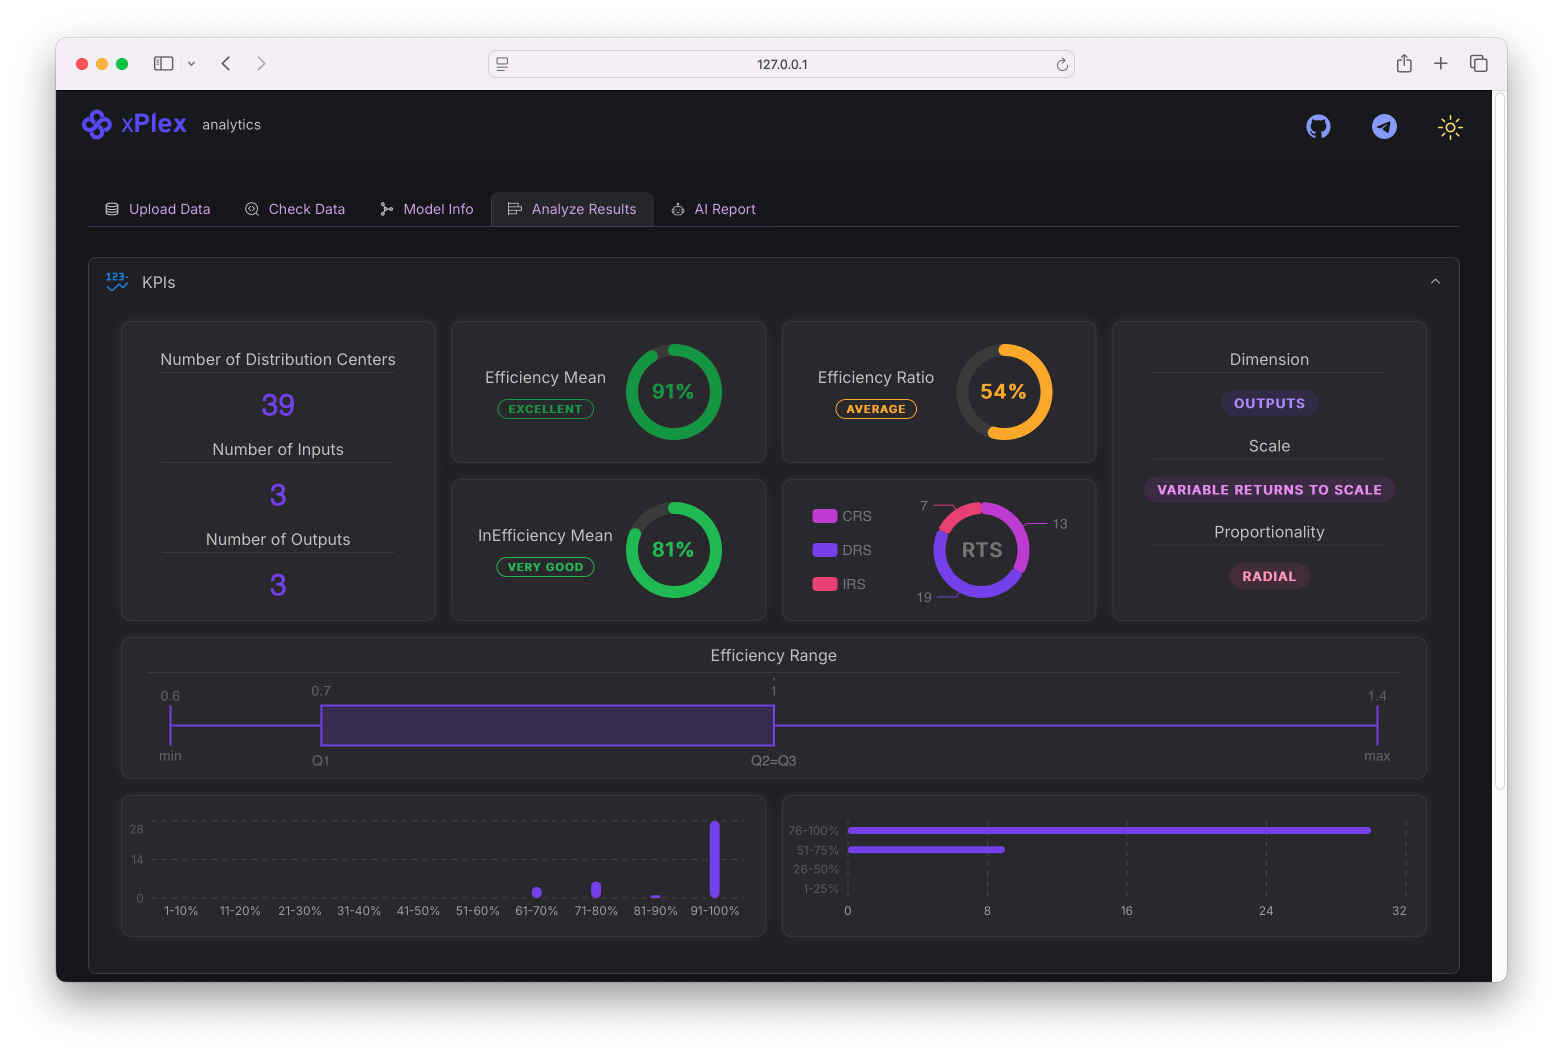
Warning: 89% of analyzed NASDAQ stocks fail efficiency standards! One of the key strengths of xPlex is its ability to systematically filter out stocks that, even under optimistic scenarios, are not worthy of investment consideration. Through sophisticated analytical frameworks, xPlex has identified a shocking reality: out of 45 major NASDAQ stocks analyzed for 2024 performance, a staggering 40 stocks (89%) demonstrate suboptimal efficiency characteristics that make them unsuitable investment targets.
xPlex achieves this filtering prowess through multiple pillars of decision-making analytics, including rigorous proportionality assessments, returns-to-scale evaluations, and comprehensive risk-adjusted performance metrics. By analyzing the relationship between risk inputs (volatility, market exposure, technical risks) and performance outputs (momentum, trend strength, volume dynamics), xPlex draws precise inferences about which securities fail to deliver adequate returns relative to their risk profile. This systematic approach prevents investors from falling into the trap of investing in popular but fundamentally inefficient stocks that consume excessive resources while delivering subpar returns.
2. Data Model Structure
2.1 Key Features of the Analysis Framework
The xPlex analysis evaluated 45 diverse NASDAQ stocks across multiple sectors including technology giants, healthcare innovators, consumer brands, and financial services companies. The analytical framework employed a comprehensive multi-dimensional approach that examined both risk characteristics and performance indicators without bias toward company size or market reputation.
Risk Assessment Dimensions:
- Volatility Measures: Average True Range, Bollinger Band width, and price standard deviation
- Market Risk Exposure: Beta coefficients and directional risk indicators
- Technical Risk Factors: Overbought/oversold conditions and momentum extremes
Performance Evaluation Metrics:
- Momentum Indicators: Relative Strength Index and MACD signal strength
- Trend Analysis: Average Directional Index and directional movement
- Volume Dynamics: On-Balance Volume changes and volume rate of change
- Price Performance: Rate of change measurements and trend sustainability
2.2 Data Quality and Analytical Refinements
The analysis incorporated several critical data quality enhancements to ensure robust and reliable results. All indicators were normalized to eliminate scale bias, ensuring that high-priced stocks like BKNG (Booking Holdings) were evaluated on equal footing with lower-priced securities. The framework addressed missing data through interpolation techniques and applied statistical smoothing to reduce noise in volatile technical indicators.
Sector-neutral weighting was implemented to prevent technology stock dominance from skewing results, while temporal consistency checks ensured all measurements reflected full-year 2024 performance rather than point-in-time snapshots. The analytical engine also incorporated correlation adjustments to prevent double-counting of similar risk factors, resulting in a more precise efficiency measurement system.
3. Analysis Results and Investment Warnings
3.1 The Shocking Reality: Major Tech Giants Fail Efficiency Tests
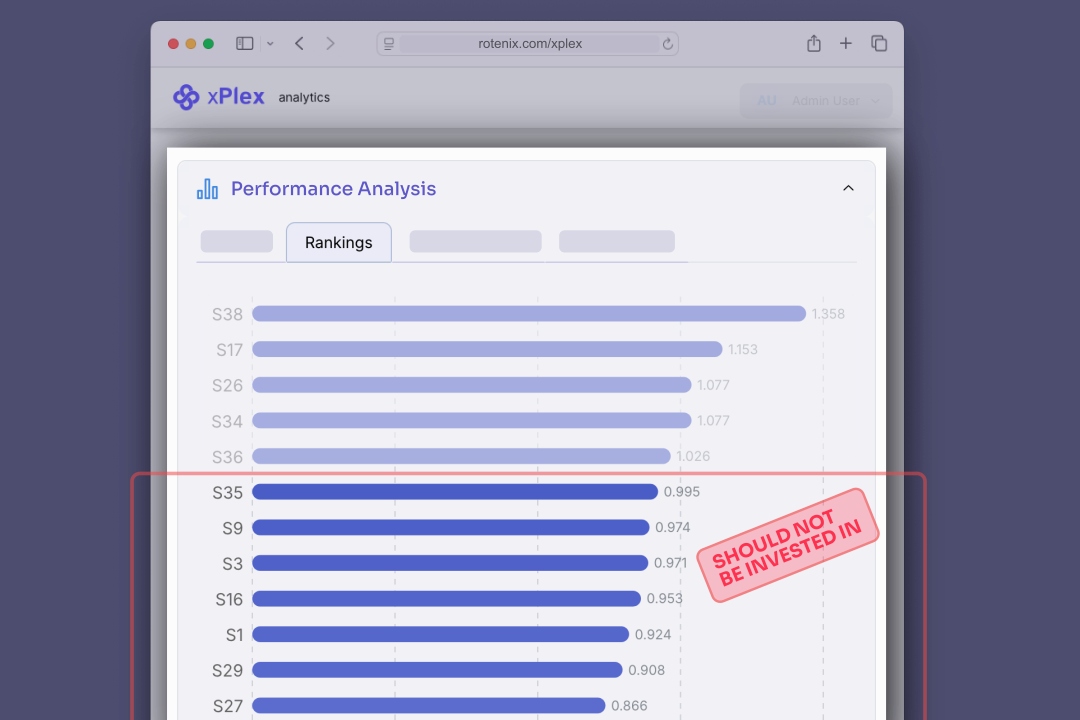
The results reveal a startling conclusion that challenges conventional investment wisdom. Major technology stocks including Apple (AAPL), Google (GOOGL), Microsoft (MSFT), Amazon (AMZN), and Meta (META) all demonstrated efficiency scores below the investment threshold, with scores ranging from 0.609 to 0.971. These companies, despite their market dominance and brand recognition, consume excessive risk resources relative to their performance delivery.
High-Profile Failures Include:
- Apple (AAPL): 92.4% super-efficiency - Premium valuation without proportional risk-adjusted returns
- Microsoft (MSFT): 97.1% super-efficiency - Despite strong fundamentals, risk-return ratio remains suboptimal
- Google (GOOGL): 84.7% super-efficiency - High volatility undermines consistent performance delivery
- Amazon (AMZN): 64.4% super-efficiency - Massive risk exposure with insufficient technical momentum
- Meta (META): 60.9% super-efficiency - Extreme volatility with poor risk-adjusted performance
3.2 Why These Stocks Should Be Avoided
The fundamental issue with these inefficient stocks lies in their disproportionate risk consumption relative to performance generation. Companies like Tesla (TSLA) with only 45.1% efficiency and Coinbase (COIN) at 36.4% efficiency represent extreme examples of investments that demand enormous risk tolerance while delivering inconsistent returns. These stocks exhibit several problematic characteristics:
Structural Inefficiencies:
- Excessive Volatility: High Average True Range and Bollinger Band width indicating unstable price action
- Poor Risk-Adjusted Momentum: Low RSI and MACD performance relative to volatility exposure
- Weak Volume Support: Insufficient volume momentum to support price movements
- Trend Inconsistency: Low Average Directional Index scores indicating lack of sustainable trends
Investment Risks:
- Capital Inefficiency: Higher capital requirements for equivalent returns available elsewhere
- Opportunity Cost: Resources tied up in underperforming assets miss superior alternatives
- Risk Concentration: Excessive exposure to volatility without adequate compensation
3.3 The Efficient Few: Lessons from Winners
Only five stocks achieved efficiency scores above the investment threshold: FOXA (135.8%), GILD (115.3%), COST (107.7%), PEP (107.7%), and CMCSA (102.6%). These companies demonstrate superior risk management, consistent momentum generation, and efficient capital utilization. They represent defensive sectors (consumer staples, healthcare, media) that deliver steady performance without excessive risk exposure.
4. xPlex + AI Capabilities: The Future of Investment Decision Making
4.1 Advanced Analytical Intelligence
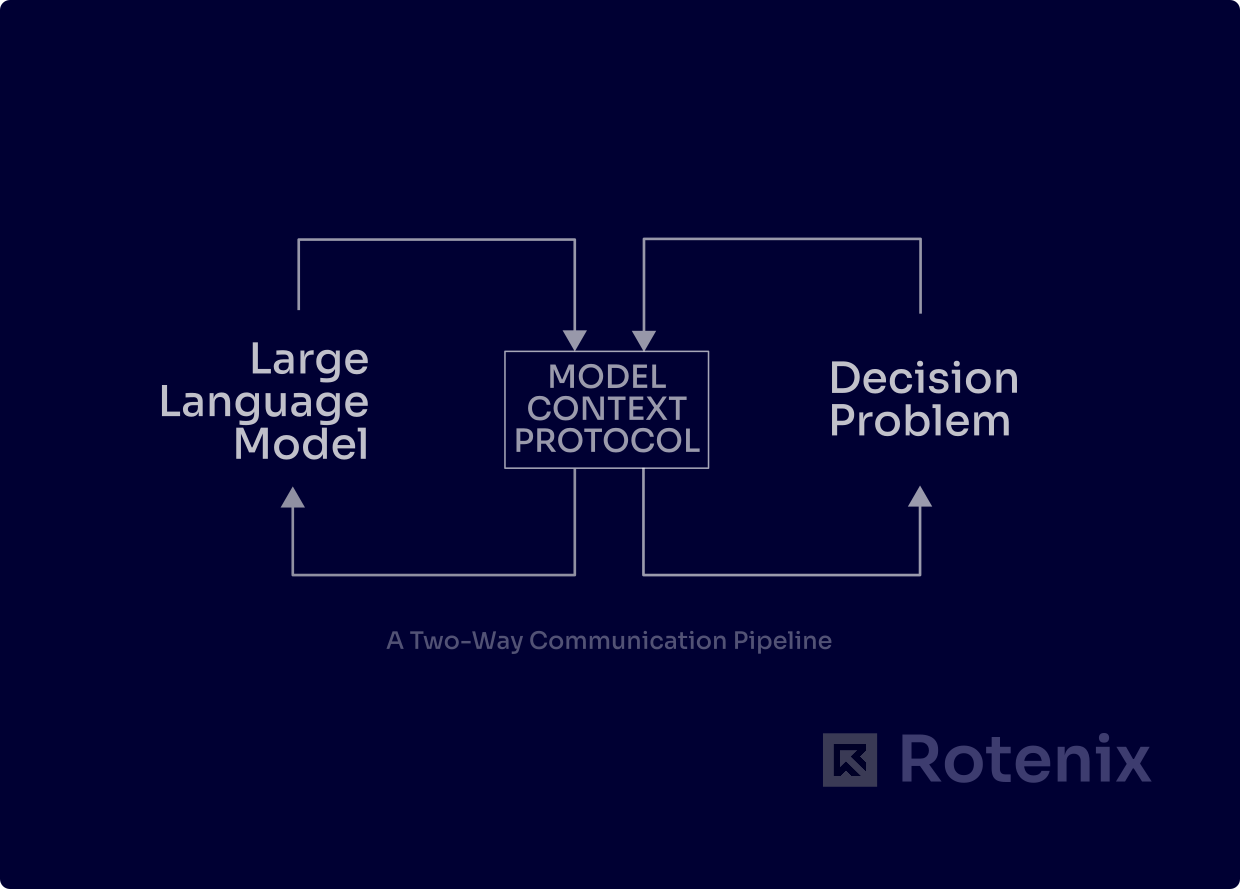
xPlex (rotenix.com/xplex) represents the cutting edge of investment analysis technology, combining traditional quantitative methods with advanced artificial intelligence capabilities. The platform’s AI engine continuously learns from market patterns, identifying subtle relationships between risk factors and performance outcomes that human analysts might miss. This machine learning approach enables real-time adaptation to changing market conditions and evolving risk landscapes.
The AI component of xPlex provides several revolutionary advantages: predictive efficiency modeling that forecasts future performance based on current risk profiles, dynamic threshold adjustment that adapts investment criteria to market cycles, and portfolio optimization algorithms that balance risk and return across multiple securities simultaneously. Unlike static analytical tools, xPlex’s AI continuously refines its analytical framework based on actual market outcomes.
4.2 Making the Right Investment Decisions
xPlex’s integration of artificial intelligence with rigorous analytical frameworks provides investors with unprecedented insight into investment efficiency. The platform’s ability to process vast amounts of technical data, identify hidden patterns, and generate actionable investment recommendations represents a quantum leap forward in investment technology. By systematically filtering out inefficient investments and highlighting superior opportunities, xPlex enables investors to make data-driven decisions that optimize risk-adjusted returns.
The combination of sophisticated efficiency analysis and AI-powered insights ensures that investors can navigate complex markets with confidence, avoiding the common pitfalls of investing in popular but fundamentally inefficient securities. Through xPlex, the investment decision-making process becomes scientific, systematic, and significantly more successful in achieving long-term wealth creation objectives.
This analysis demonstrates the power of advanced analytical frameworks in identifying investment inefficiencies that traditional methods miss. The results challenge conventional wisdom about “safe” blue-chip investments and highlight the importance of rigorous risk-adjusted performance evaluation in modern portfolio management.
Access data: rotenix-github